RareCal

Good FID. Wrong number of extremes.
Measure it, then fix it, without retraining.

FID and its relatives summarize the bulk of a distribution. RareCal audits the rare end: how often a generator produces its 1-in-1,000 extremes compared with real data, with intervals that hold when only a few extremes are seen, and a post-hoc wrapper that repairs the rate by moving about 1% of the samples.
Results at a glanceThe tail is where good models disagree

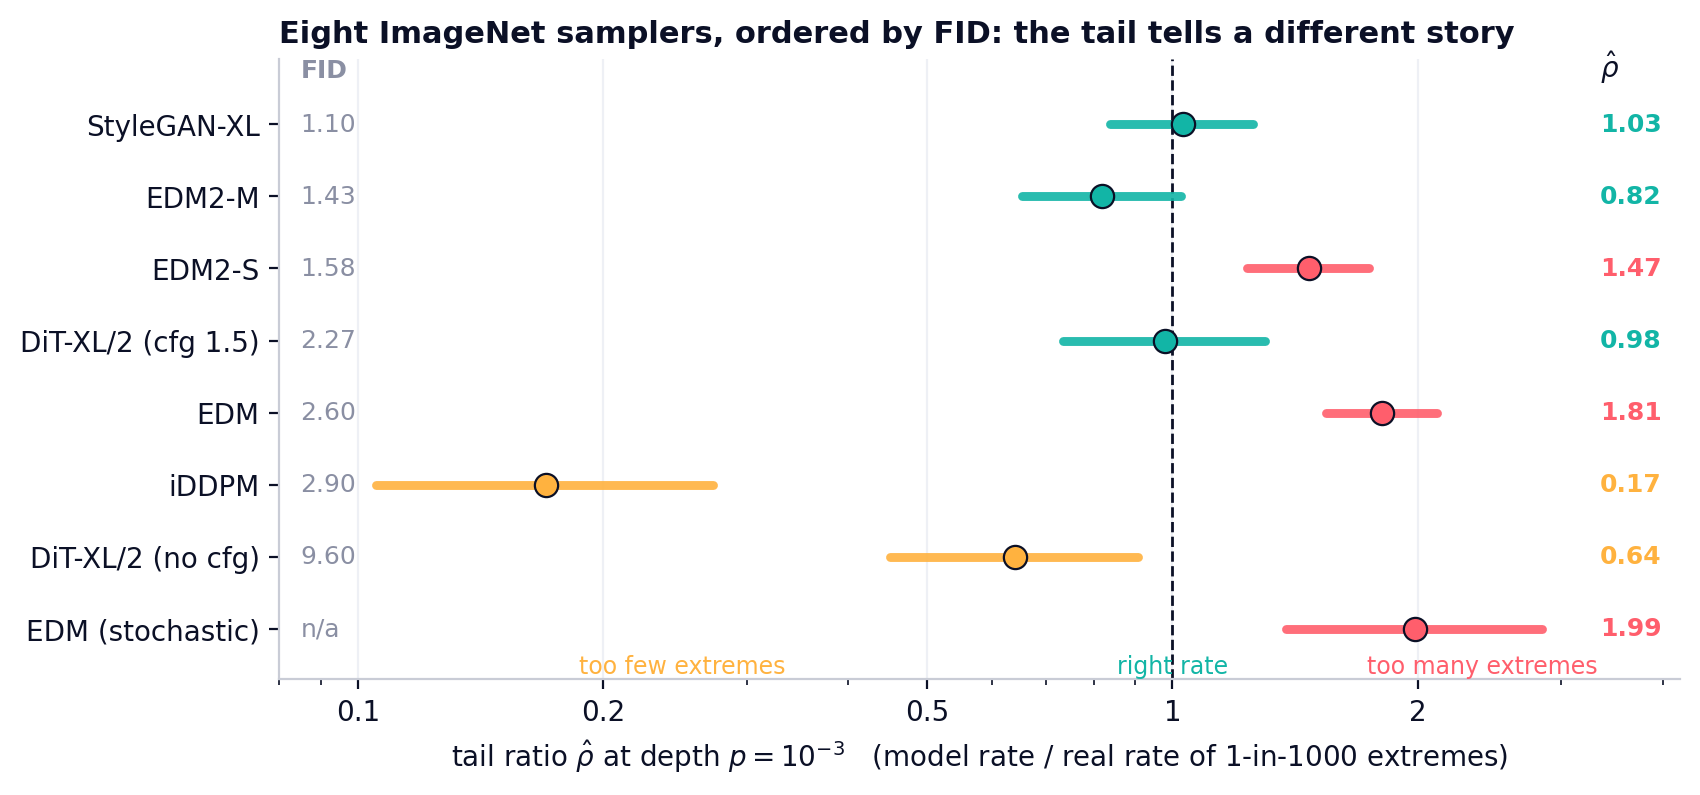
Eight public ImageNet samplers (GAN, pixel diffusion, latent diffusion), audited against 1.08 million held-out real images on a common 32×32 grid. Ordered by published FID, their rates of 1-in-1,000 extremes range from 6× too few to 2× too many.

Tail ratio at depth 1e-3 for eight ImageNet samplers, ordered by FID
ρ̂ = (model rate) / (real rate) of samples beyond the real 99.9th percentile of severity. Bars: 95% intervals including the error of the real threshold.
11.7×

spread in the rate of extremes across eight samplers; only 3 of 8 cover the real rate

≤ 1%

of samples moved by the wrapper, which brings all seven wrapped samplers to ρ̂ ∈ [0.98, 1.03]

25 / 32

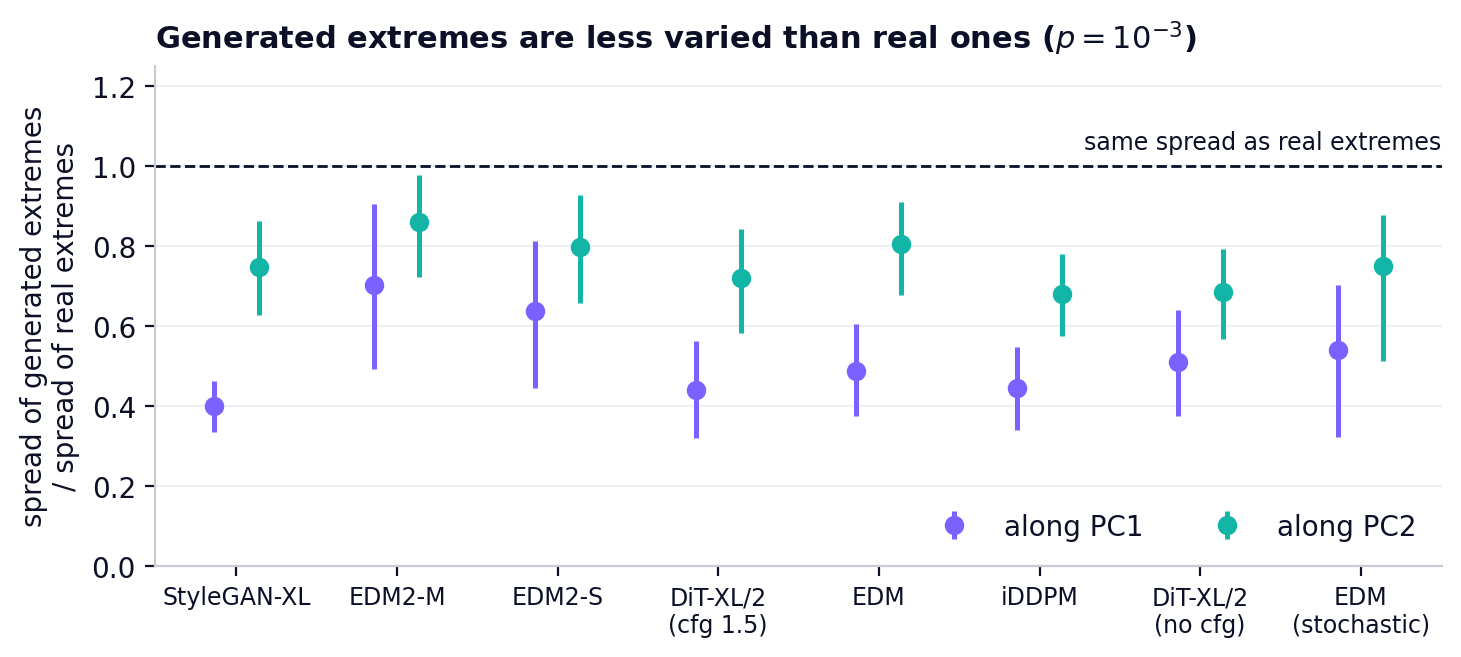
tests find generated extremes less varied than real ones (Brown–Forsythe, Holm)

≤ 0.1%

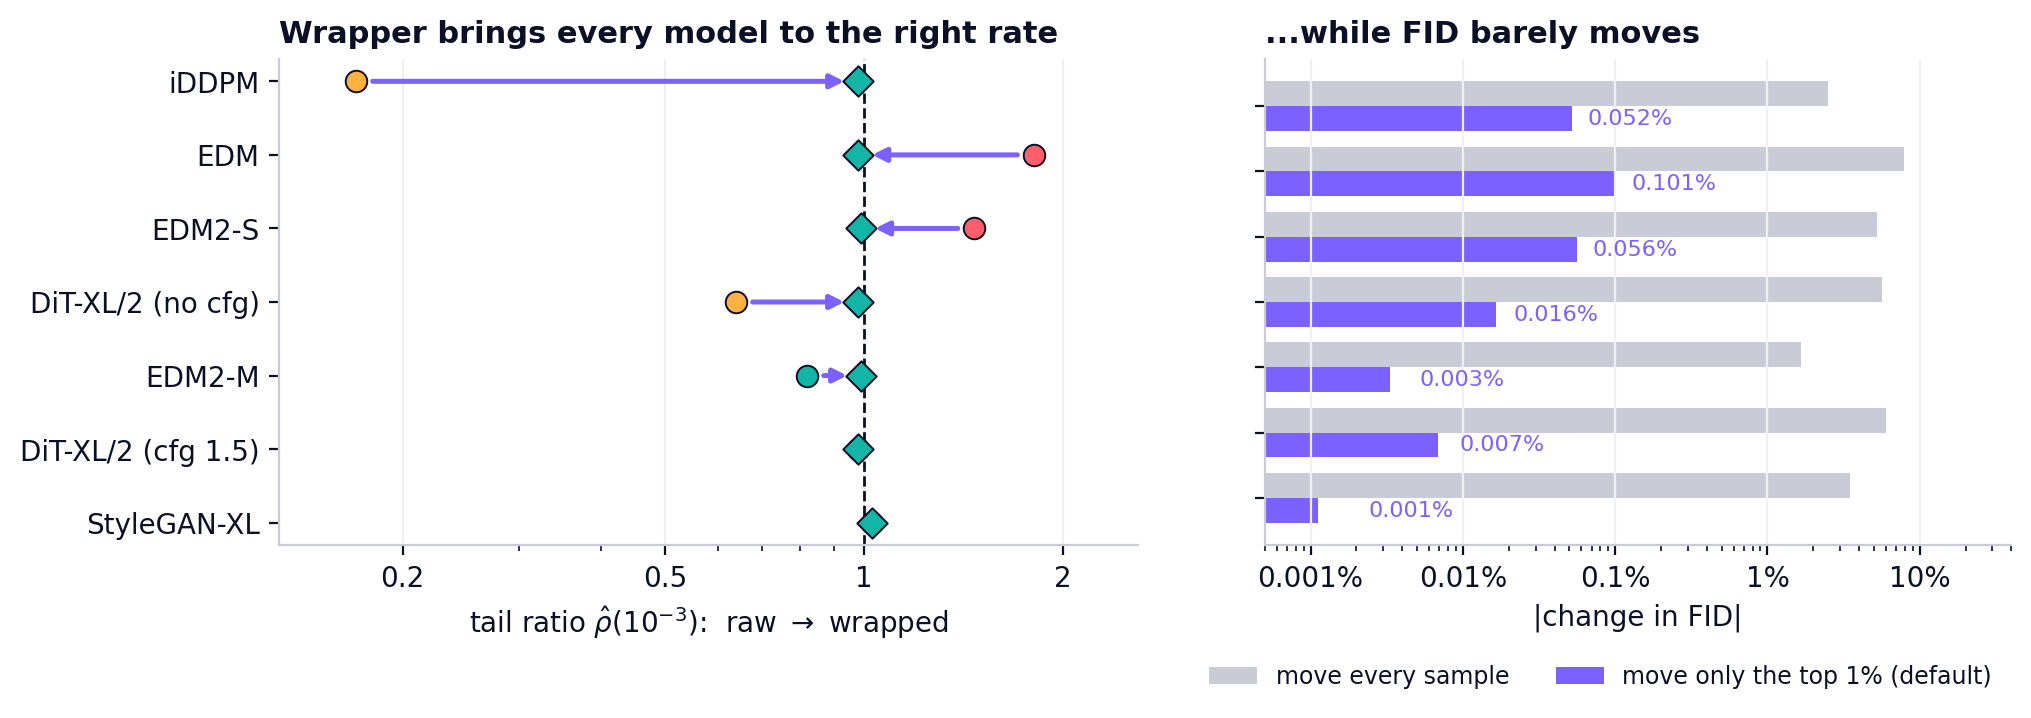
change in FID after wrapping; moving every sample instead costs up to 7.9%

5.6×

too many 1-in-1,000 extremes for a DDPM on CelebA-HQ 256; StyleGAN2-ADA is on target

−0.43

rank correlation between published FID and the tail ratio (p = 0.34): no usable link

3,238

draws any test needs to tell ρ = 1 from ρ = 2 at depth 10⁻⁴ (lower bound)

0

weights, gradients or retraining steps needed by the audit or the wrapper

RepairRight rate of extremes, FID intact

The wrapper ranks a batch by severity, assigns each sample the matching quantile of the real calibration law, and moves only the top 1% of ranks to their targets along a shape-preserving transport.

Tail ratio before and after wrapping, and change in FID
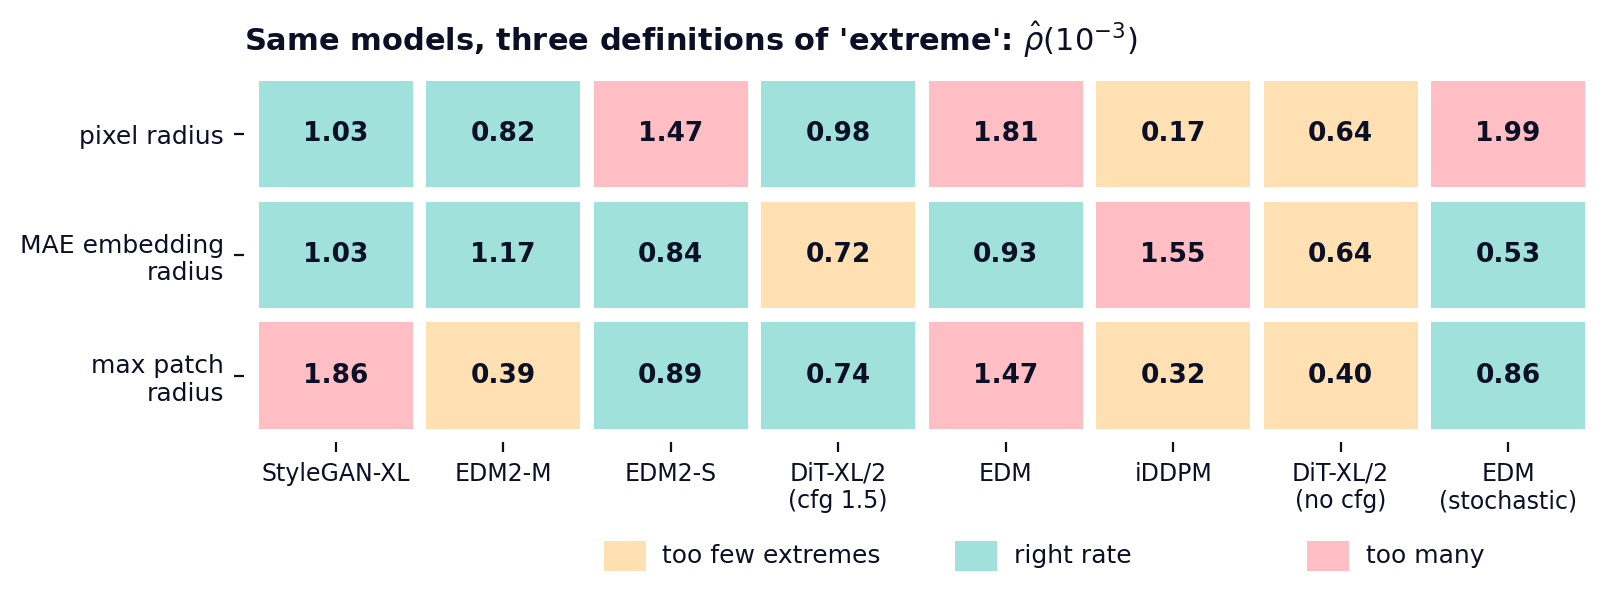
Tail ratios under three severity functionals
“Extreme” is a choice: pixel, embedding and worst-patch severities rank the same models differently.
Spread of generated versus real extremes
Even at the right rate, generated extremes are less varied than real ones.

How it worksThree steps, all black-box

1

Define & calibrate

Pick a severity R(x) (default: whitened PCA radius). Fit the calibration law on real data: empirical bulk, generalized-Pareto tail.

2

Audit

Count model samples beyond the real (1−p)-quantile. Wilson interval plus threshold error; verdict under / calibrated / over.

3

Repair

Rank remap to the calibration law and move each tail sample to its target severity. No weights, no gradients.

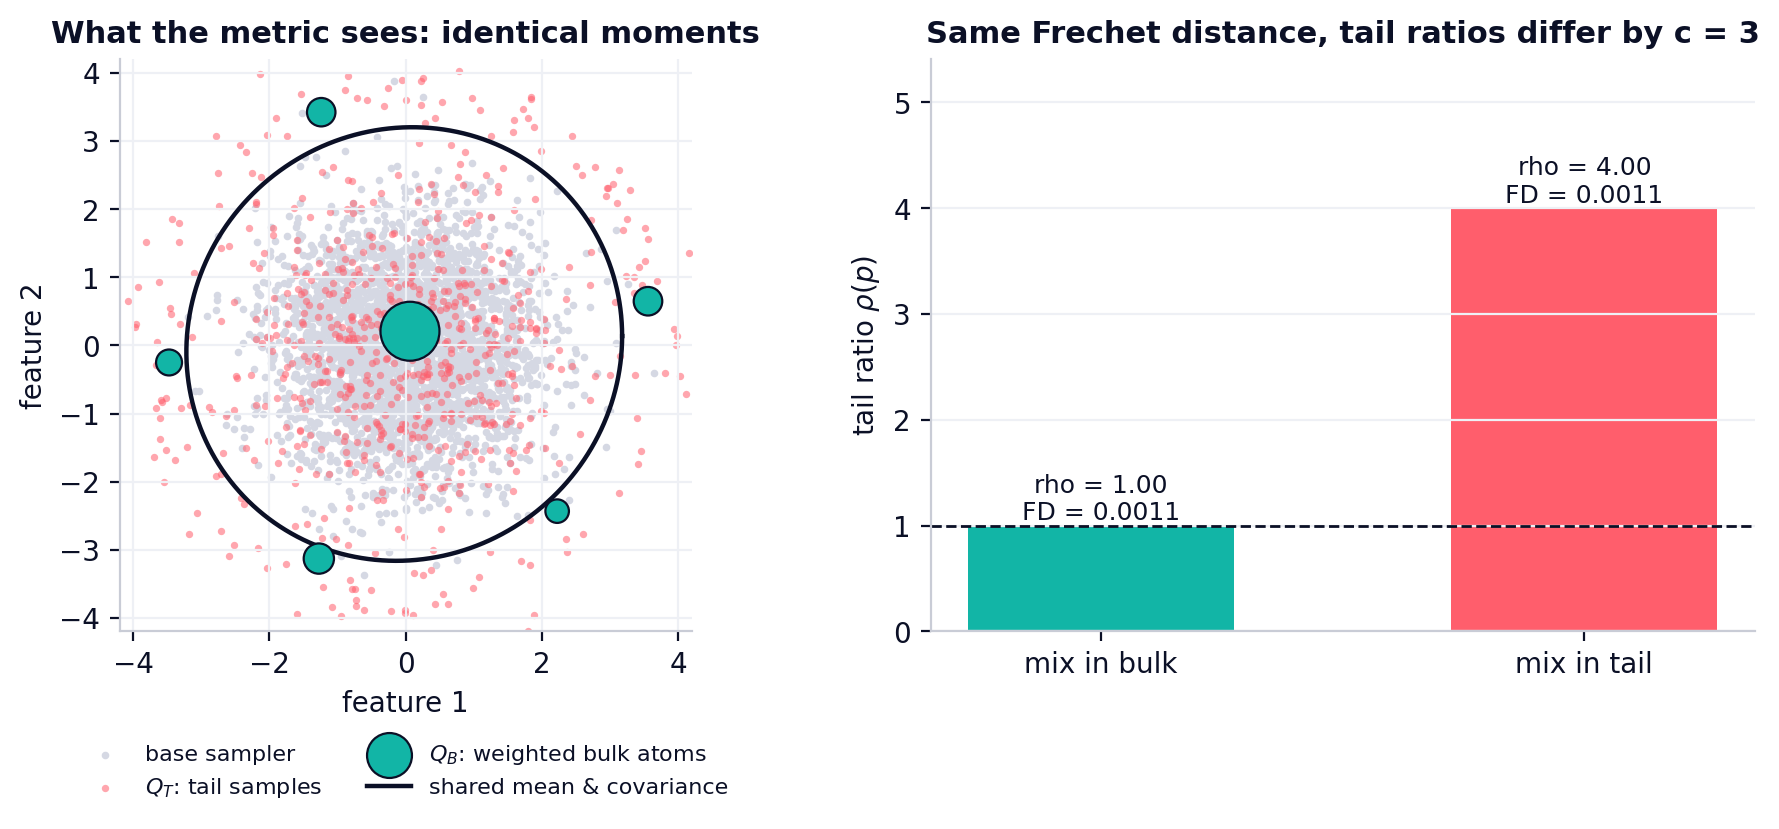
Two samplers with the same Frechet distance and different tail ratios
Why FID cannot see it: two mixtures with identical feature mean and covariance, hence identical Fréchet distance, whose tail ratios differ by exactly c = 3.

QuickstartTen lines, numpy and scipy only

# install
git clone https://github.com/ziwaa-se/rarecal.git && cd rarecal
pip install -e ".[examples]"
python examples/01_quickstart.py
import rarecal as rc

sev = rc.WhitenedRadius(n_components=50).fit(real_calib)      # what "extreme" means
law = rc.CalibrationLaw.fit(sev(real_calib))                 # empirical bulk + GPD tail

print(rc.audit(sev(samples), sev(real_heldout), depths=[1e-2, 1e-3]))
wrapped = rc.Wrapper(sev, law, tail_only=0.99)(samples)     # repair, no retraining
       p     tau_p       k        M  rho_hat       95% interval  verdict
   1e-02     8.148    3865   200000     1.93  [  1.85,   2.02]  over
   1e-03    11.423     737   200000     3.68  [  3.24,   4.14]  over
--- after wrapping (2% of samples moved)
   1e-02     8.148    1956   200000     0.98  [  0.93,   1.03]  calibrated
   1e-03    11.423     192   200000     0.96  [  0.80,   1.13]  calibrated

ExamplesRunnable demos

01 · Quickstart

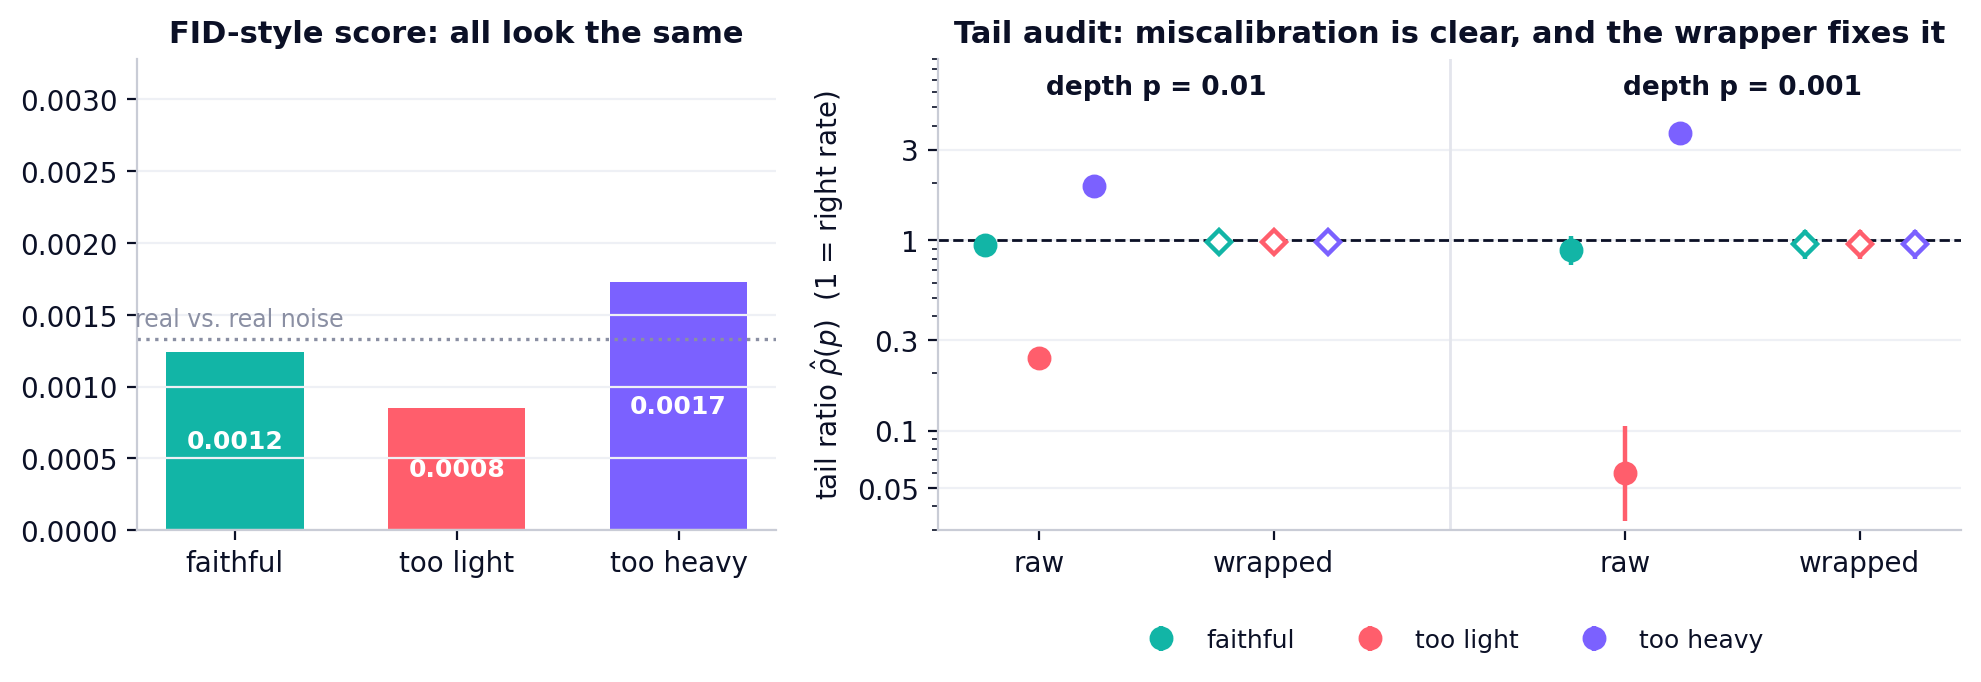
Three samplers with identical moments: FID-style scores tie, the audit separates them, the wrapper fixes them.

02 · The blind spot

Exact construction of two samplers with the same Fréchet distance and a 3× different tail ratio.

03 · Sample budget

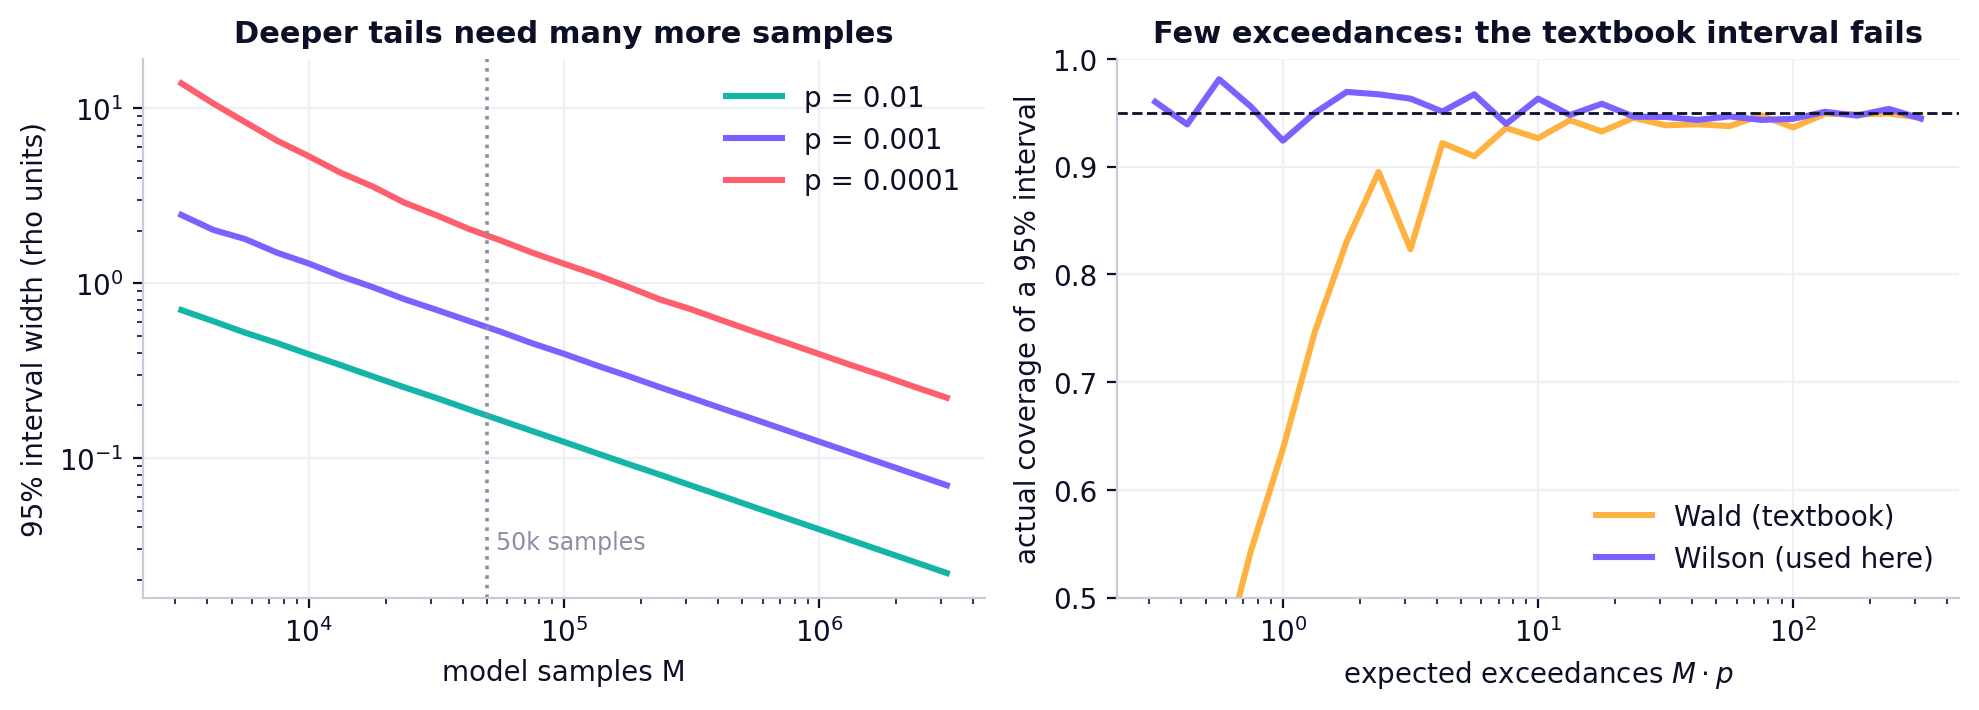
How many samples a deep-tail audit needs, and why the textbook interval fails with few exceedances.

04 · Transports

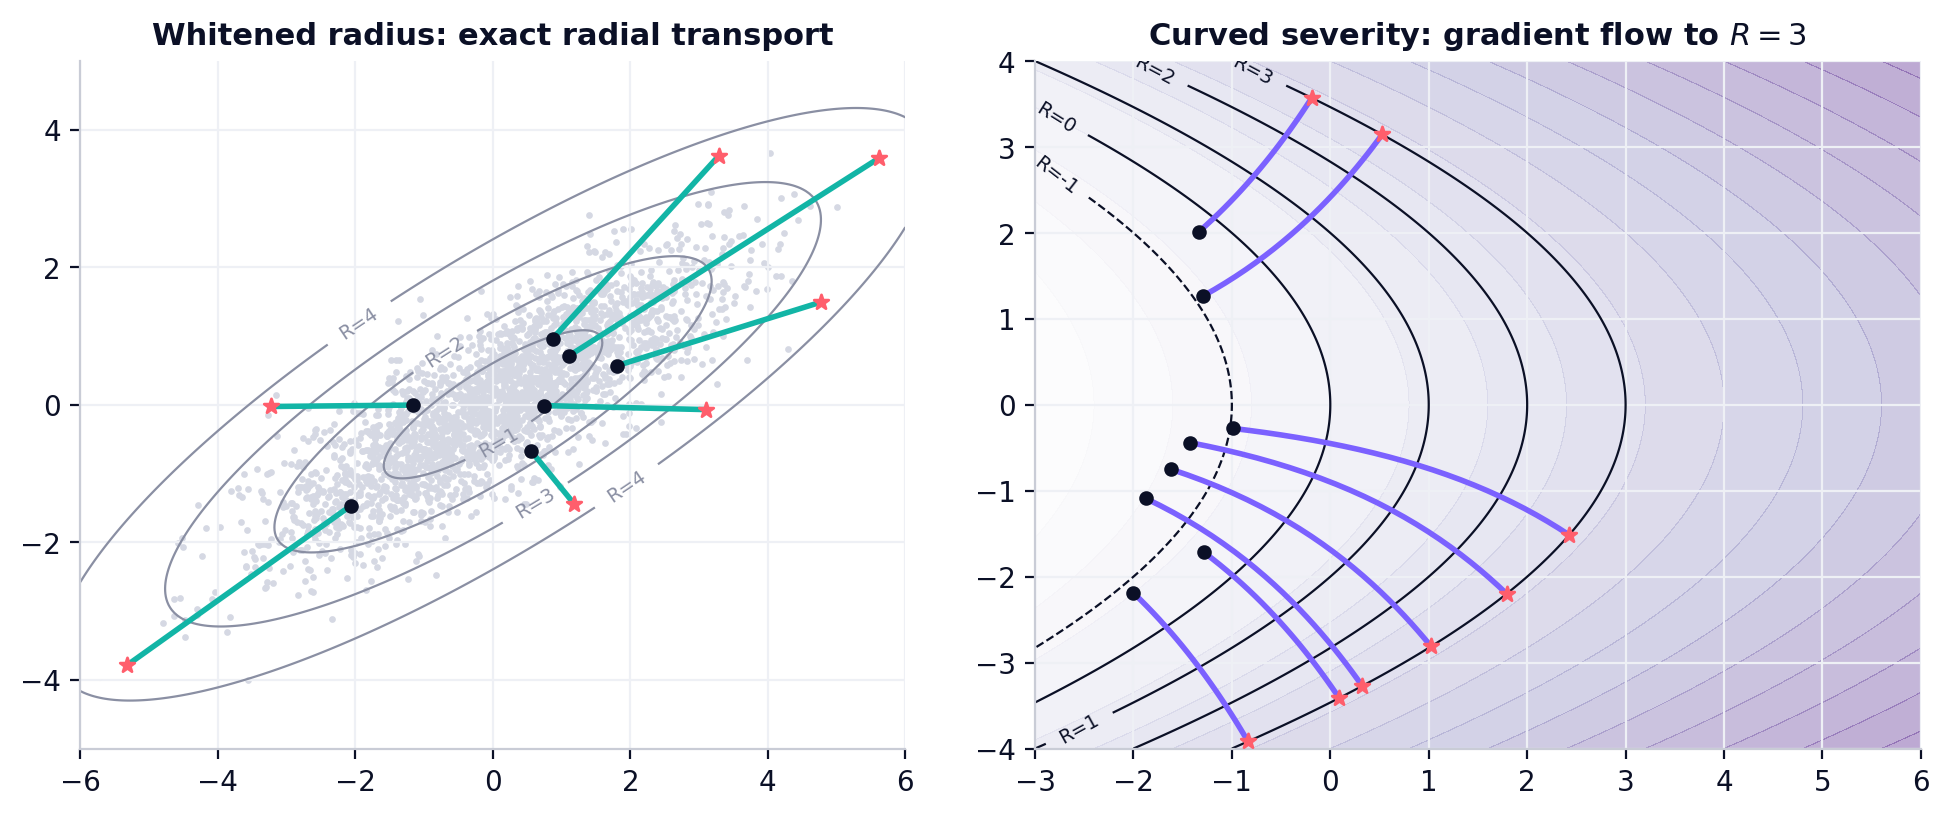
Moving a sample to a target severity: exact radial rescaling and gradient flow for curved severities.

ReproducibilityFrom laptop to full pipeline

LevelNeedsRunTime
Library & theoryCPUpytest -q, examples/0*.py< 1 min
Every figure & numberCPU + results/*.csvscripts/make_results_figures.py< 1 min
Full pipelineGPUs, public checkpoints, ImageNet / CelebA-HQreproduce/days